01 / 2026 / Dashboard / Analytics
Davis Presentation
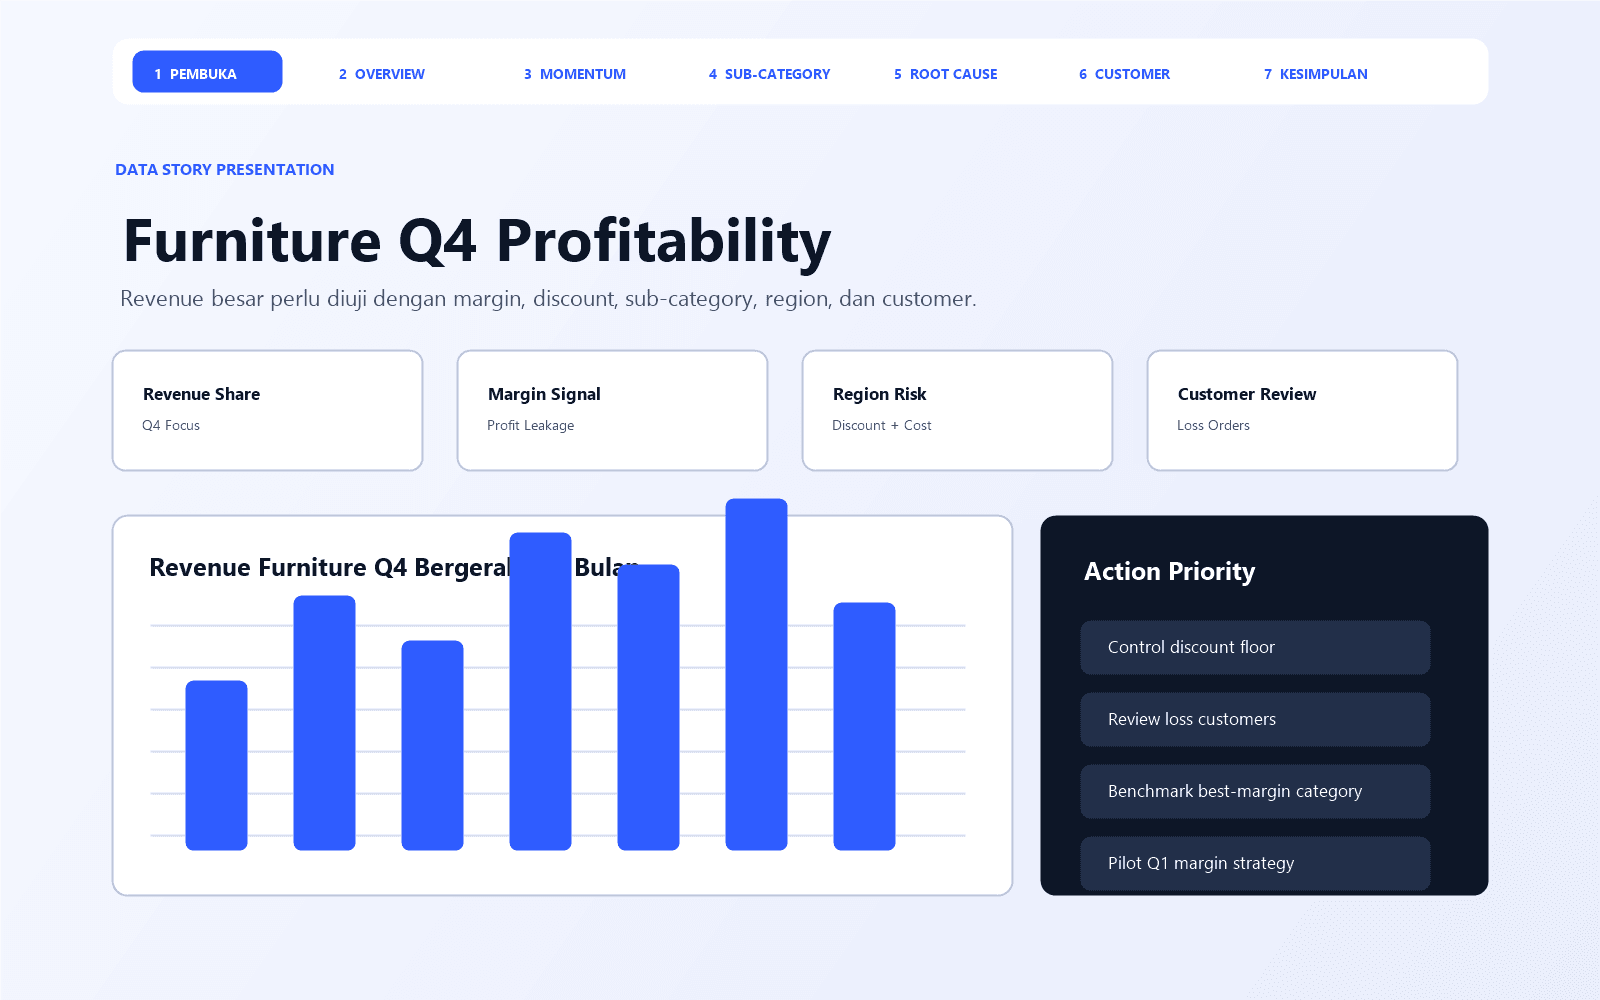
The presentation needed to move beyond descriptive charts and create an executive story that explains why Furniture revenue momentum still needs margin control.
Client
Context and business domain
00 / Design System
Palette Logic
Dashboard / Analytics
01
2026
Typography
Inter
Aa Bb Cc Dd Ee Ff Gg Hh Ii Jj Kk Ll Mm Nn Oo Pp Qq Rr Ss Tt Uu Vv Ww Xx Yy Zz 0123456789
Layout Grid
12-column responsive index structure.
Deep Slate
#0D1B1E
Graphite
#3D3D3D
Clear White
#F8F8F8
Soft Signal
#C9FBC6
Connected System
Data Storytelling connects the visual language, interaction rhythm, and evidence structure for this case study.
01 / Challenge
The Challenge
The presentation needed to move beyond descriptive charts and create an executive story that explains why Furniture revenue momentum still needs margin control.
02 / Methodology
Methodology / Experiment
- 01
Story Arc Planning
Structured the presentation as hook, context, momentum, root cause, customer evidence, and action priority.
7 narrative tabs86% - 02
Metric Framing
Compared Q4 Furniture revenue with profit margin, discount pressure, sub-category leakage, and customer-level loss orders.
Q4 scope82% - 03
Executive Review
Audited chart titles, hierarchy, and action notes so each slide can support a short management presentation.
Audit notes78%
03 / Solution
The Solution
Narrative Dashboard Deck
A tabbed presentation format where every view carries one clear business claim and supporting chart evidence.
Profitability Action Board
Final recommendations turn data signals into margin-control priorities for discount, region, and customer review.
04 / Impact
Impact & Metrics
07
Story Sections
The dashboard is arranged as a seven-part presentation instead of a flat chart gallery.
Q4
Focused Scope
The analysis narrows the business question to Q4 Furniture performance and margin quality.
04
Action Themes
The final view prioritizes discount, customer, benchmark, and Q1 margin actions.