02 / 2026 / Dashboard / Analytics
Dashboard Analitik Superstore
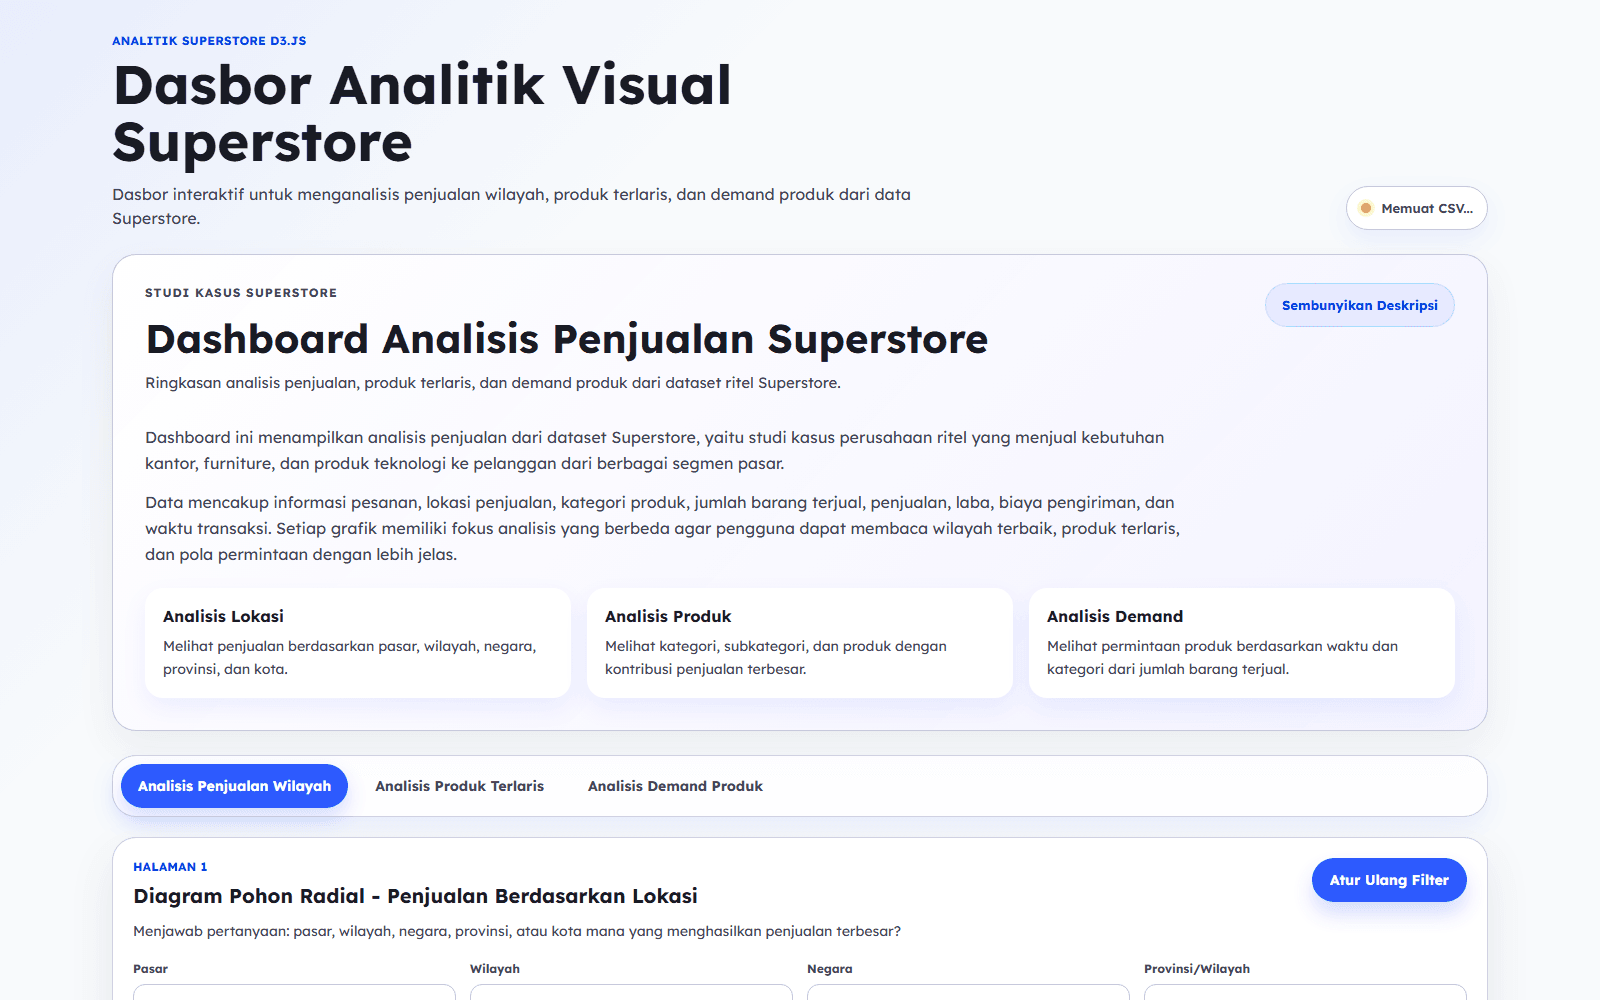
The dataset contains many overlapping sales dimensions, so the dashboard needed distinct analytical pages that do not repeat the same insight.
Client
Context and business domain
00 / Design System
Palette Logic
Dashboard / Analytics
02
2026
Typography
Inter
Aa Bb Cc Dd Ee Ff Gg Hh Ii Jj Kk Ll Mm Nn Oo Pp Qq Rr Ss Tt Uu Vv Ww Xx Yy Zz 0123456789
Layout Grid
12-column responsive index structure.
Deep Slate
#0D1B1E
Graphite
#3D3D3D
Clear White
#F8F8F8
Soft Signal
#C9FBC6
Connected System
Interactive Visualization connects the visual language, interaction rhythm, and evidence structure for this case study.
01 / Challenge
The Challenge
The dataset contains many overlapping sales dimensions, so the dashboard needed distinct analytical pages that do not repeat the same insight.
02 / Methodology
Methodology / Experiment
- 01
Question Mapping
Separated the dashboard into location, product, and demand questions so every chart has a different analytical job.
3 views88% - 02
Hierarchy Design
Used radial tree and zoomable sunburst patterns to expose market, region, country, category, sub-category, and product relationships.
D3 hierarchy84% - 03
Filter Logic
Built page-specific filters and summary states so exploration remains readable across different segments and time levels.
Scoped filters80%
03 / Solution
The Solution
Visual Analytics Workspace
A responsive dashboard with KPI summaries, tabbed analysis pages, and interactive D3 visualizations.
Demand Exploration View
Radial stacked bars and filters help users inspect when demand changes by category, market, segment, and time level.
04 / Impact
Impact & Metrics
51K+
Rows Loaded
The public dashboard loads and visualizes the Superstore transaction dataset in-browser.
03
Analysis Pages
Location, product, and demand are separated into focused analytical workflows.
D3
Visualization Core
The project uses custom D3 charts instead of static report screenshots.